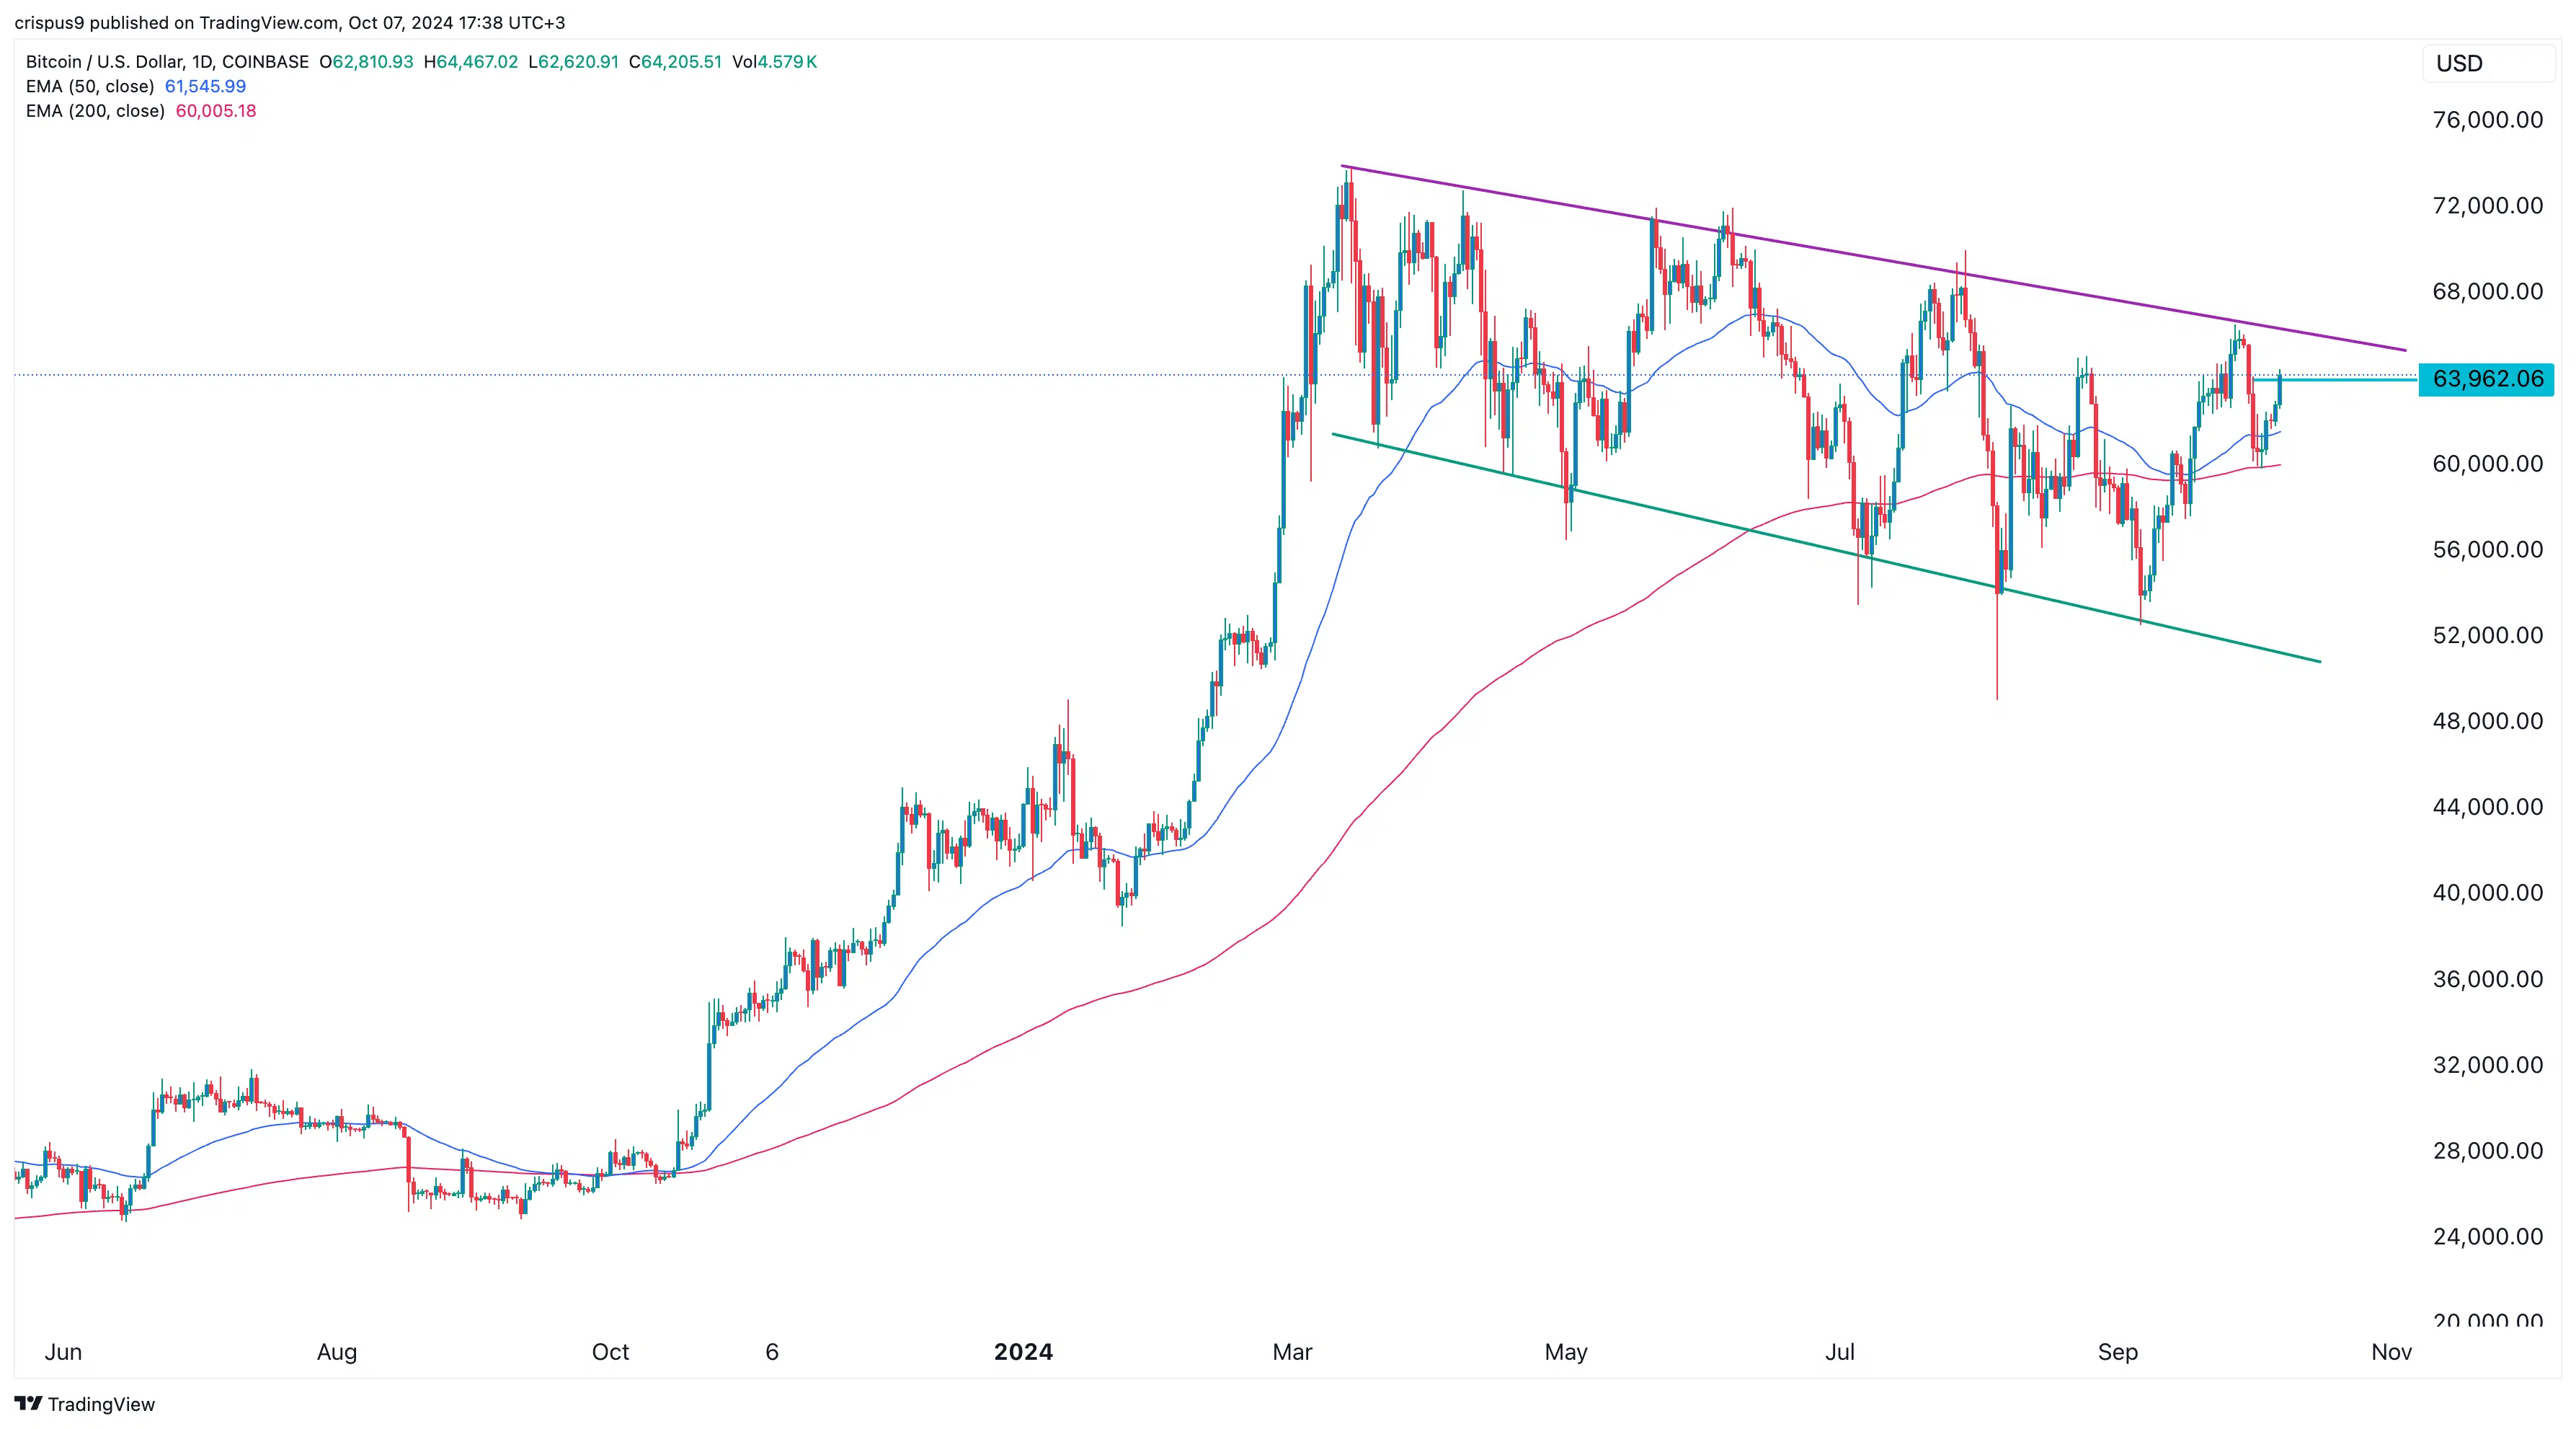
On Monday, October 7, the price of Bitcoin increased for two consecutive days as traders adopted a risk-on stance
Bitcoin experienced a 6.62% increase from its lowest point last week, reaching an intraday high of $64,000.
Even though American equities experienced a decline, the rebound occurred as the probability of a Federal Reserve that was more dovish subsided. Early trading declined over 0.20% in the Dow Jones, S&P 500, and Nasdaq 100.
Bitcoin continues to inspire optimism among certain crypto analysts and investors.
MetaPlanet, a Japanese company, has recently added coins valued at $6.7 million to its reserves, thereby becoming the most recent significant Bitcoin client.
Bitcoin Treasuries reports that it currently possesses 530 coins, which are valued at over $33 million.
The organization is emulating MicroStrategy, which has amassed 252,220 Bitcoin coins and has emerged as the largest Bitcoin possessor.
Marathon Digital, Riot Platforms, and Block, which was previously known as Square, are among the other significant holders.
Michael van de Poppe, a renowned crypto analyst with a following of over 728,000, predicted in an X post that Bitcoin would retest the all-time peak of $73,800.
He anticipates that Bitcoin will retest $62,000 and subsequently rebound to a range of $65,000 to $66,000. A retest of the all-time peak will occur if the price breaks above that level.

A substantial increase in futures open interest occurred concurrently with Bitcoin’s recovery.
Open interest reached its greatest level since October 1 with a rise to more than $34 billion, according to data from CoinGlass. A coin is frequently regarded favorably when its open interest figure is elevated.
The Federal Reserve minutes on Wednesday and the US inflation data on Thursday are the next prospective catalysts for Bitcoin this week.
A more dovish Federal Reserve is likely to result from a sign that inflation is still declining, which would be advantageous for Bitcoin and other risky assets.

A reversal of the Bitcoin pricing is $66,600
Bitcoin has encountered substantial resistance, as indicated by the purple bars on the daily chart. This resistance is the link between the most significant fluctuations in March, May, June, July, and September.
The upper side of the falling broadening wedge chart pattern is also the trendline. This pattern frequently leads to a favorable breakout in price action analysis. Additionally, Bitcoin has surpassed the 50-day and 200-day Exponential Moving Averages.
Consequently, there is a growing likelihood that Bitcoin will experience a bullish breakout and retest the all-time high. In order for this to occur, it is probable that the psychological levels of $70,000 and $72,000, as well as the descending trendline, must be cleared.


