Over the last ten weeks, the price of Bitcoin has been trapped below $69,000, but economists think this is a good price movement.
Crypto analysts believe that BTC$69,255 is about to enter price discovery, provided it breaks through the crucial resistance at its previous all-time high of $69,000.
Around $69,000 was the peak price of Bitcoin during the 2021 bull run. Following the US government’s approval of spot Bitcoin exchange-traded funds (ETFs) earlier this year, this level was tested again on March 5.
Bitcoin has stayed below this mark for roughly ten weeks despite multiple attempts to rise above it.
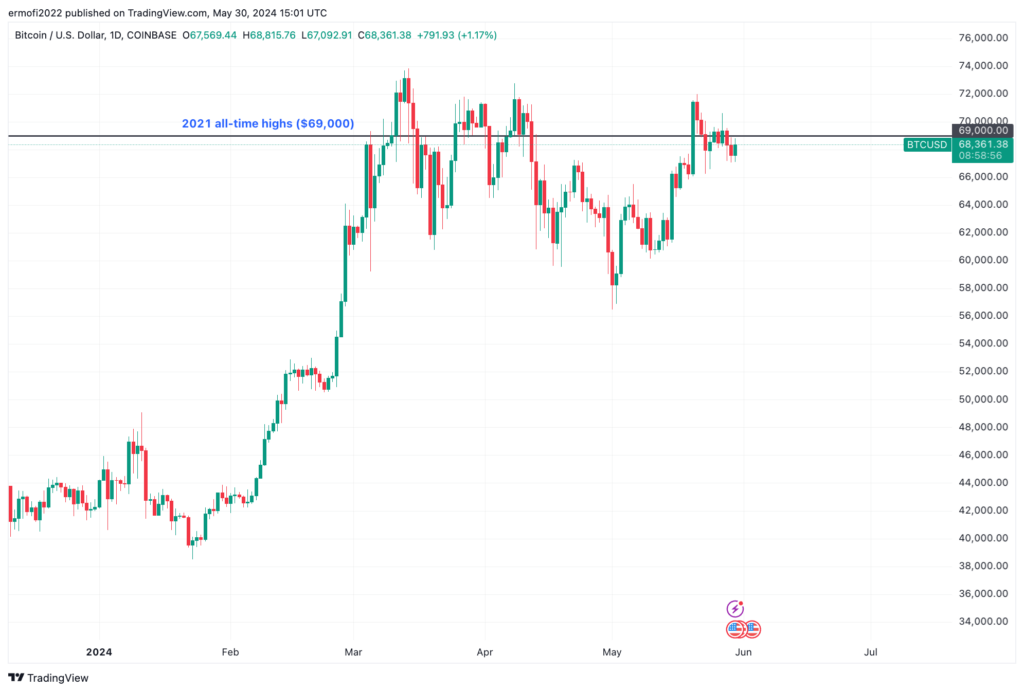
The battle to break records is “never an easy fight,” according to cryptocurrency analyst Daan Crypto Trades, and it typically takes time to succeed.
He pointed out that, to achieve favorable results, supply must “dry up” around the resistance zone, and coins must move from impatient to patient holders.
“Bitcoin is fighting the last resistance before full-on price discovery,” he said.
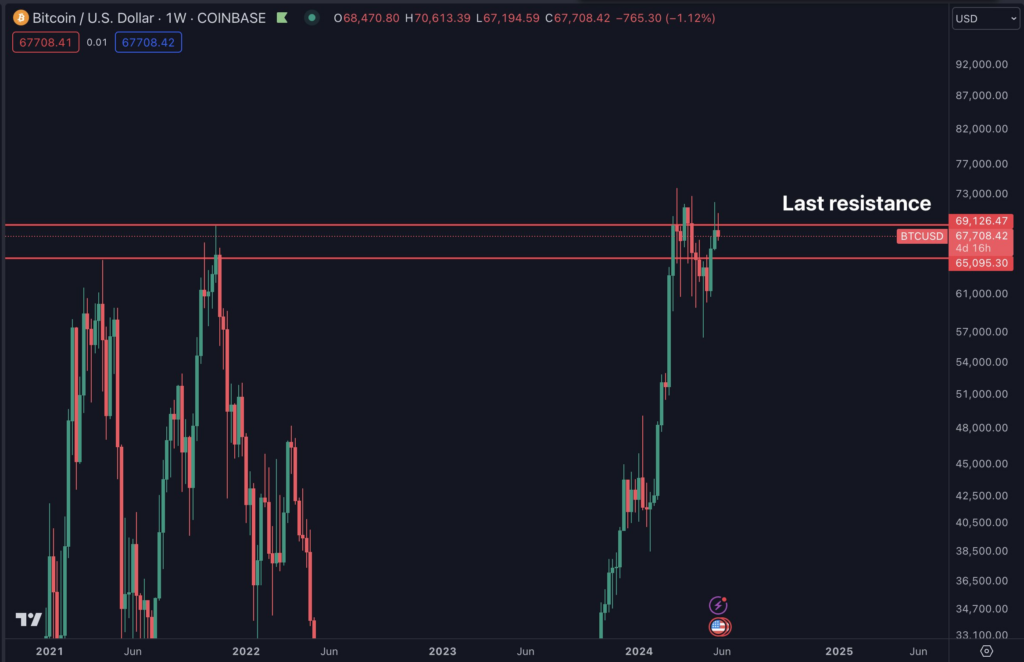
Several cryptocurrency analysts echo this optimistic outlook. In a post on May 30 on X, crypto expert Jelle stated, “Bitcoin’s market structure remains firmly bullish!” The price has been in a “steady uptrend for well over a year now, consolidating right below the current all-time highs.”
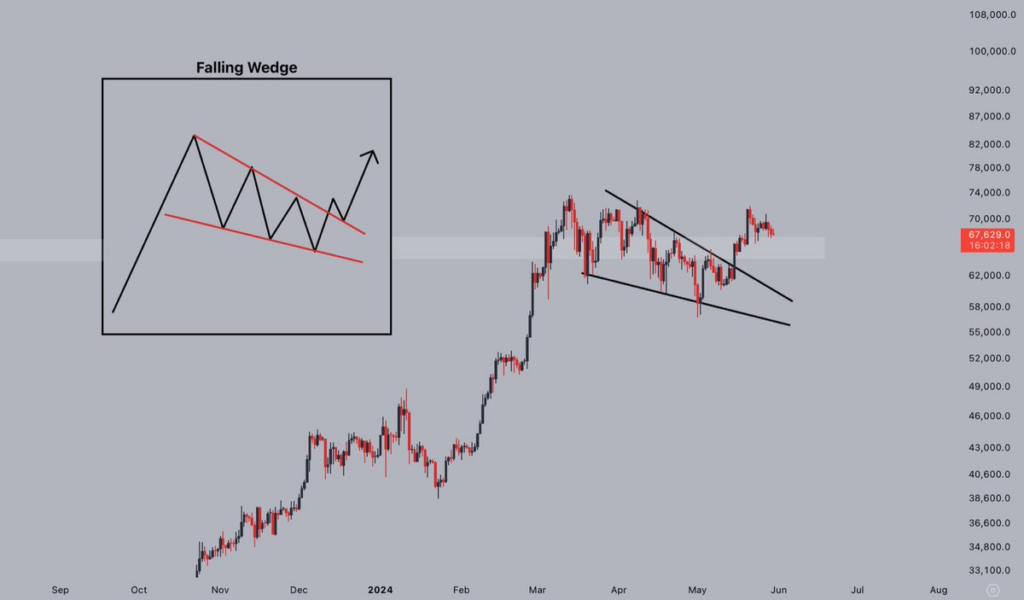
Jelle mentioned in a different X post that the price of Bitcoin was “breaking out from the falling wedge” daily and was now retesting a crucial support level.
“Hold here, and new all-time highs should come soon enough,” he stated.
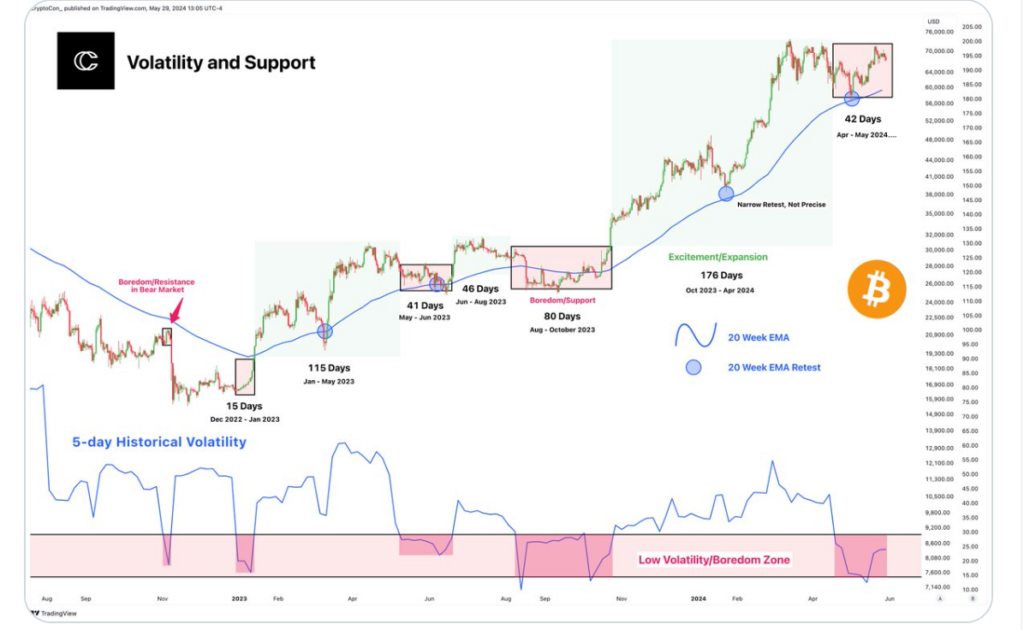
The current low volatility of Bitcoin around its prior highs, according to pseudonymous crypto analyst CryptoCon, is a sign of healthy price activity.
“August through October of 2022 was one of the least volatile months in Bitcoin’s history, and this is only half of that time.” They stated in a post on X on May 29 that “these periods of low volatility are crucial to building support for the next leg up.”
“The next green box is loading.”
There is increased sell-side pressure at “$100M in sell orders sitting around $69K,” according to Daan Crypto Trades.
Just below this resistance, $68,700 represents a sizable area of bid liquidity, according to CoinGlass data.
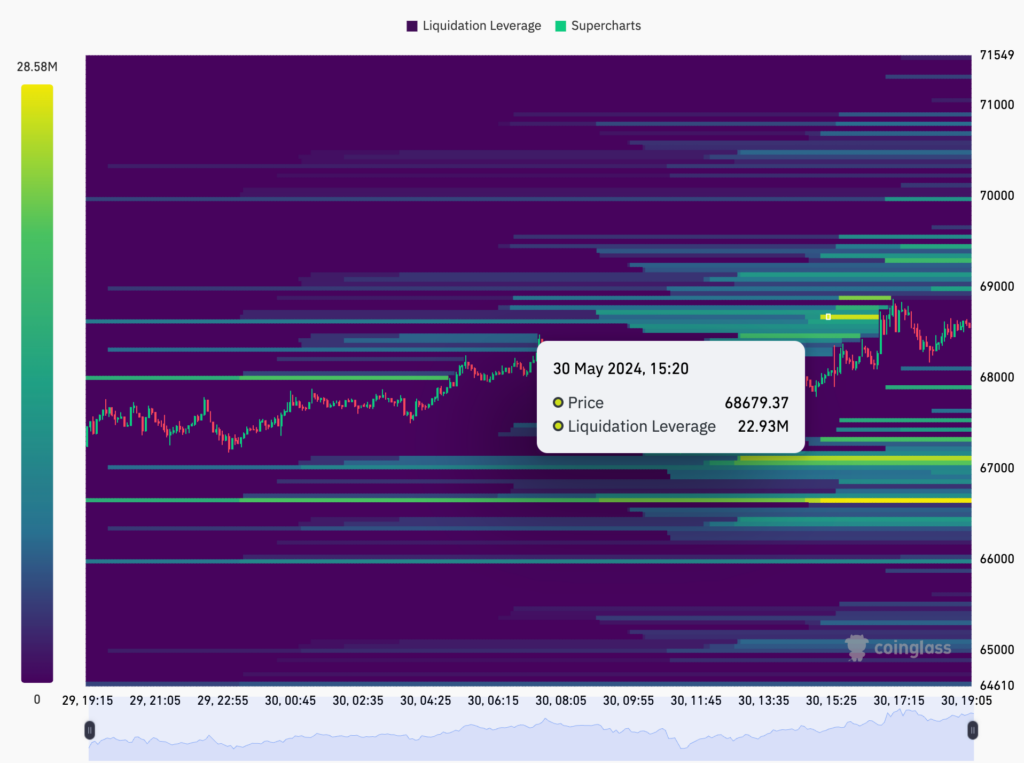
On May 30, at the time of publication, the price of Bitcoin was $68,485, up 1.5% from the previous day.
