Bitcoin bulls expect this is the final time that the downward-sloping channel resistant to the price of BTC will be tested.
A crucial weekly close is coming up for Bitcoin as bulls try to snap a seven-month decline.

BTC price at last signals a significant breakout
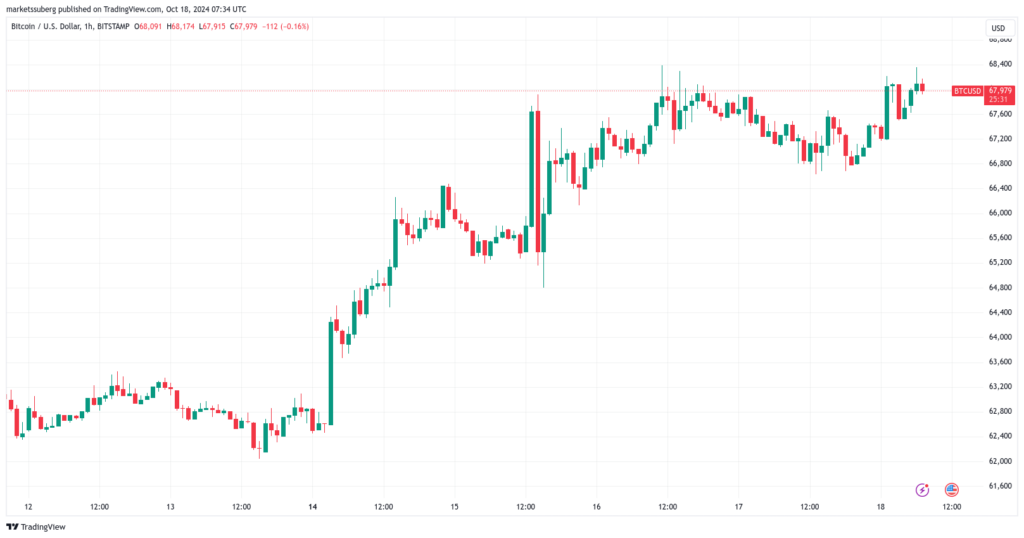
Cointelegraph Markets Pro and TradingView data show that the price of bitcoin is trying to break through resistance that has been in place since the all-time high in March.
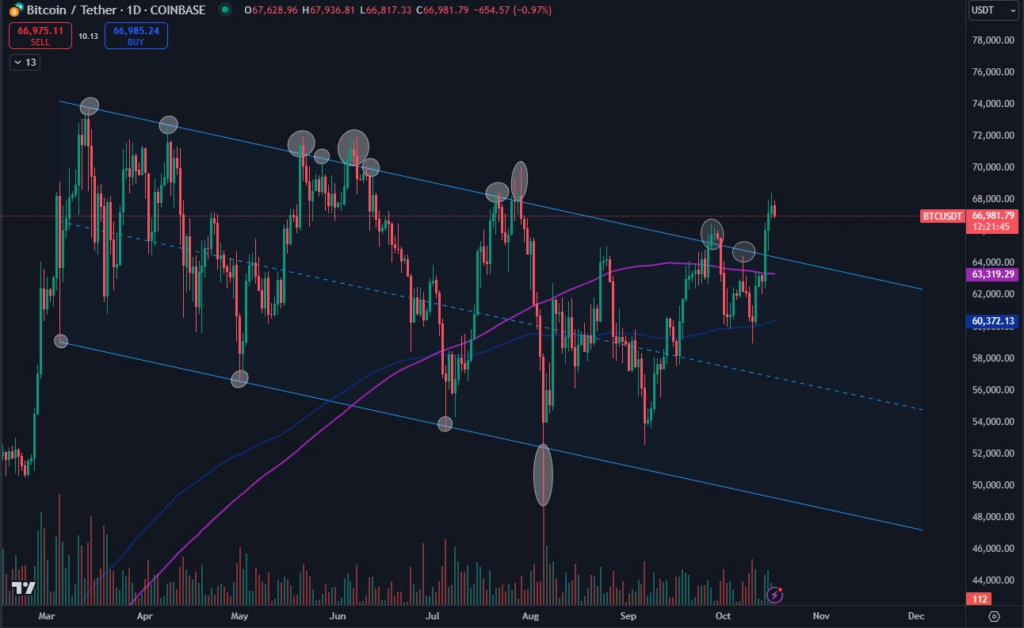
Since reaching its all-time high of $73,800, Bitcoin BTC$67,888 has been consolidating within a downward-sloping channel for over six months.
The price of Bitcoin/USD has stayed rangebound ever since despite multiple attempts to reenter price discovery. Traders are hoping that the landscape has changed.
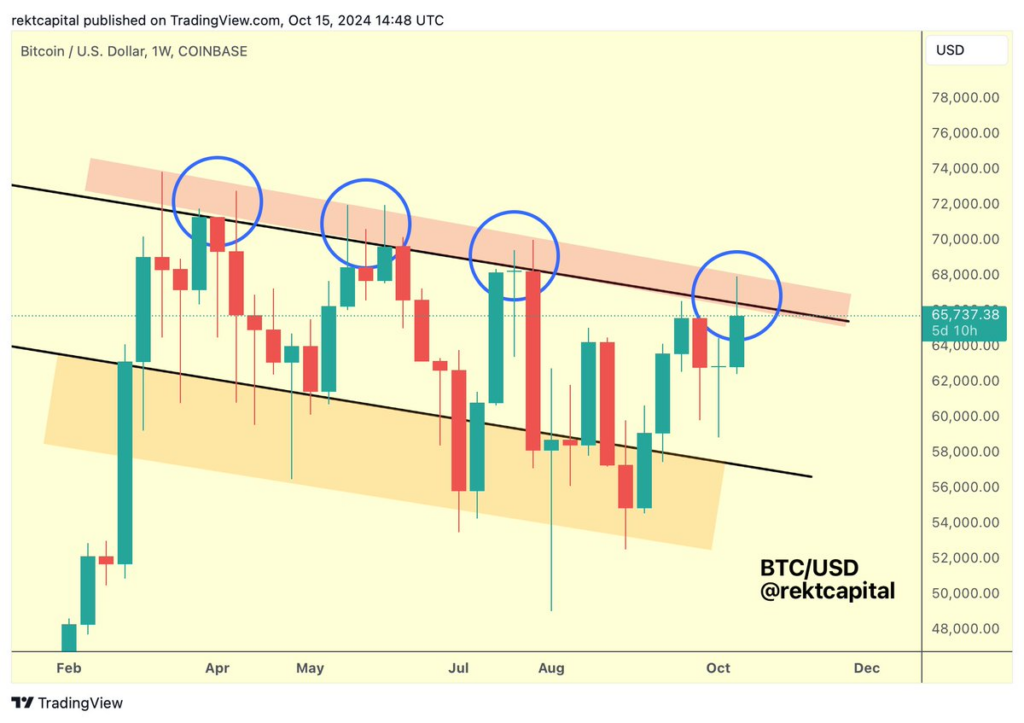
Rekt Capital, a trader and analyst, noticed recurrent attempts to breach the upper edge of the channel on the weekly chart, with the most recent one occurring this week.
“Just like in the past (blue circles), Bitcoin has encountered a rejection from the top of the downtrend Channel (red).”
“It’s essential Bitcoin Weekly Closes inside the red resistance to avoid a deeper rejection from here.”

As long as buyers maintain their pressure and allow bears little leeway, a weekly close above the channel top, currently at almost $68,000, is already within reach.
“It’s still early in the week,” Rekt Capital said in closing.
“Generally, we need to observe this Downtrending Channel resistance (red) for signs of weakening compared to previous rejections.”

Because daily closures are already taking place outside the channel, there is more reason for optimism on shorter timeframes.
Another trader and analyst, Daan Crypto Trades, informed X followers, “With the recent move, it has finally broken out of the channel it traded in for most of 2024.”
The 200-day simple moving average (SMA) and exponential moving average (EMA) clouds for Bitcoin/USD were cleared in the accompanying chart, which indicated that this had been “causing some struggles since the Summer.”
Daan Crypto Trades continued, “The trend for the short-mid timeframe is also up.”
Institutional demand for Bitcoin reaches new heights.
The pattern has persisted recently, as rising BTC price action sets off a domino effect among money inflows from investors.
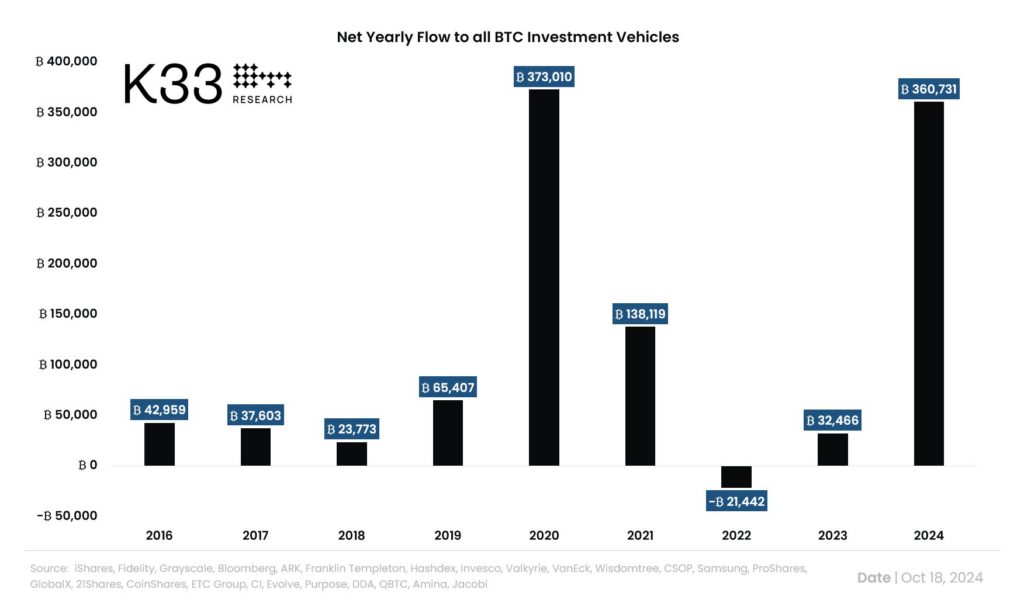
Vetle Lunde, senior analyst at crypto analytics company K33 Research, verified on October 18 that “Bitcoin investment vehicles globally have seen net yearly inflows of 360,000 BTC and are on track to surpass the Grayscale-led 2020 record of 373,000 BTC.”

The aggregate assets of spot Bitcoin exchange-traded funds (ETFs) in the United States have risen to a new all-time high of $65 billion, while net flows have surpassed a record $20 billion.
Around the $20 billion total, Eric Balchunas, a senior ETF analyst at Bloomberg, said, “For context, it took gold ETFs about five years to reach the same number.”
