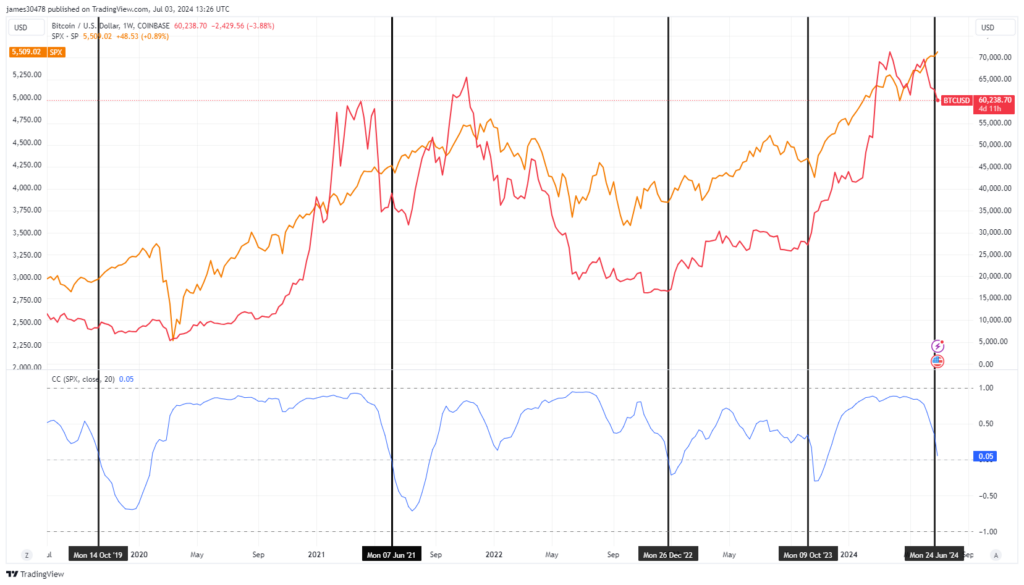
As market divergence grows, the Bitcoin and S&P 500 correlation drops below 0.05, indicating independent price movements and potential opportunities.
Amidst market divergence, the correlation between BTC and the S&P 500 falls below 0.05.
In the last five years, there have been times when there has been a positive correlation between Bitcoin (BTC) and the S&P 500 (SPX). One such instance was during the COVID-19 epidemic in 2020 and 2021 when both assets traded at almost the same ratio. This pattern persisted as the SPX and BTC fell together between the end of 2021 and the beginning of 2022. In the first quarter of 2024, the SPX and Bitcoin BTC had notable increases.
As the SPX keeps hitting new all-time highs and has crossed 5,514, Bitcoin has occasionally fluctuated between $60,000 and below. Their correlation has decreased to 0.05 over a 20-day moving average, reflecting this divergence.

Four times in the past year, there have been negative correlations between BTC and SPX: in October 2019, during a bear market for Bitcoin; in June 2021, during the China mining ban, which caused BTC to drop to about $30,000; in December 2022, after the collapse of FTX, which signaled a cycle low; and in October 2023, when BTC was consolidating before a significant rally from roughly $25,000 to over $70,000 in just six months.
A local bottom in the price action of Bitcoin is frequently indicated when there is a notable divergence and negative correlation between BTC and SPX.


