A traditional Bitcoin price technical indicator predicts that the BTC price will reach its top in six months, but further declines may be anticipated shortly.
Bitcoin’s price has dropped 8% over the last week and 3% over the previous day, to BTC$91,070. However, according to market observers, this decline is typical for Bitcoin in January. Accordingly, a significant technical signal suggests that the bull market may restart, with the price of Bitcoin possibly reaching its top in mid-July 2025.

In the summer, the price of bitcoin may be high.
After its sharp ascent in 2024, which culminated in new all-time highs of $108,268 on December 17, Bitcoin is still trapped in a four-week price consolidation zone, according to data from Cointelegraph Markets Pro and TradingView.
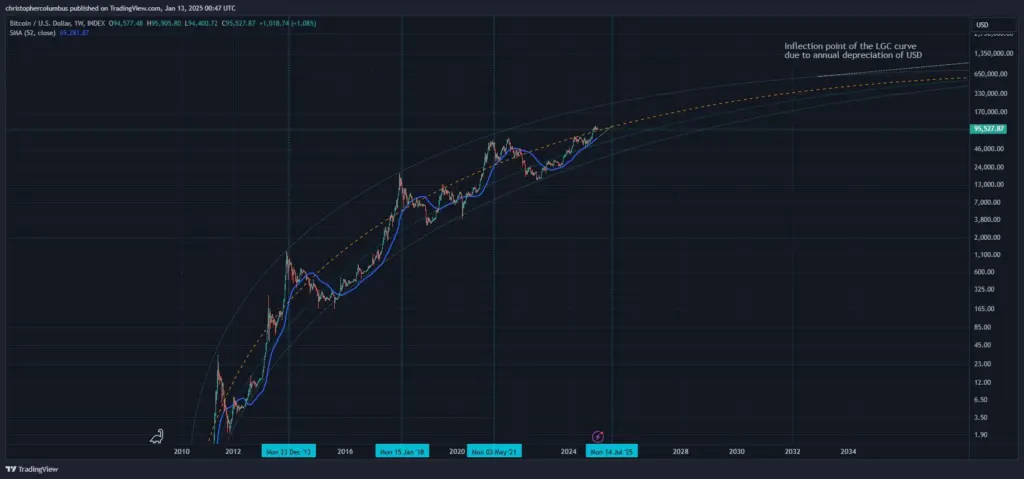
Popular Bitcoin trader and analyst Dave the Wave claims that although the price has already fallen 14% from these record highs, BTC still has more space to rise, as shown by the 52-week simple moving average (SMA).
Although several studies and data points have supported different forecasts recently, BTC has historically followed the logarithmic growth curve’s (LGC) levels, peaking when the 52-week SMA touched the channel’s middle band.
In a post on X on January 13, Dave the Wave stated that the bitcoin price “previously peaked when the one-year moving average hit the midway mark of the LGC channel.”
“The suggestion of a mid-year #BTC peak here.”

However, as the above chart shows, the price typically peaked a few days or months before or following the moving average’s crossing of the LGC’s middle line. For instance, the 52-week SMA flashed the top signal for Bitcoin on December 13, 2013, the same day the price crested.
The 52-week SMA showed the signal months early on May 3 during the 2021 bull cycle, when Bitcoin peaked at $69,000 on November 10. 2017 Bitcoin peaked on December 17, but the top signal appeared a month later, on January 15, 2018.
As a result, the 2025 Bitcoin peak may drop in the days to months leading up to or following the one-year SMA’s crossing of the LGC’s middle line, which is anticipated to occur in mid-July.
The less steep one-year moving average, as noted by Dave the Wave, indicates “a maturing market.”
The price drop of bitcoin is “in its final stages.”
Rekt Capital, a well-known cryptocurrency expert, claimed that the current consolidation in the price of Bitcoin is a component of the “first price discovery correction,” which takes place during weeks six and eight of the parabolic phase. The duration of these adjustments ranges from two to four weeks.
Rekt Capital stated in his research of X on January 11 that “this current retrace has been going on for 4 weeks now,” adding:
“Length-wise, history, therefore, suggests this correction should be in its final stages.”
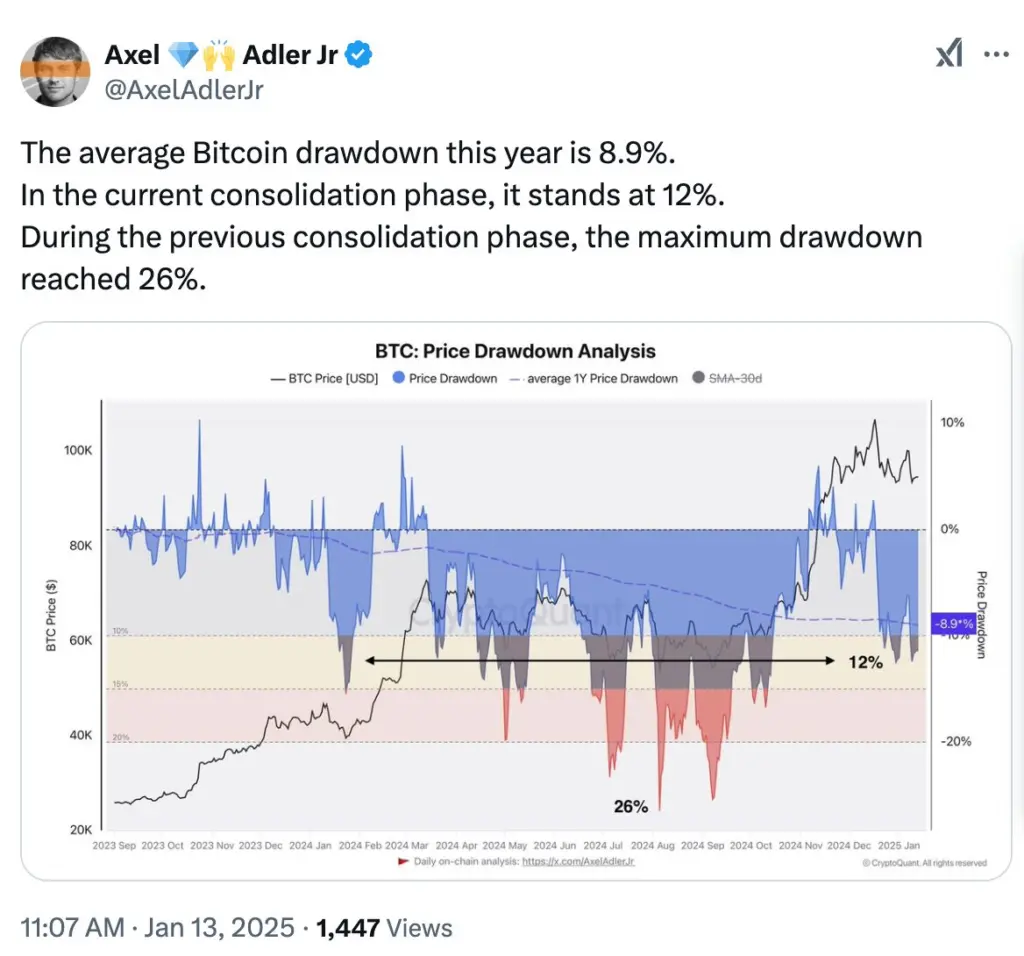
According to fellow expert Axel Adler Jr., the Bitcoin decline is not as bad as it was during the previous consolidation phase, when the cryptocurrency fell by more than 26% between July 29 and August 5, 2024.

According to analysts, post-halving years frequently see this relatively small adjustment at the start of the year.
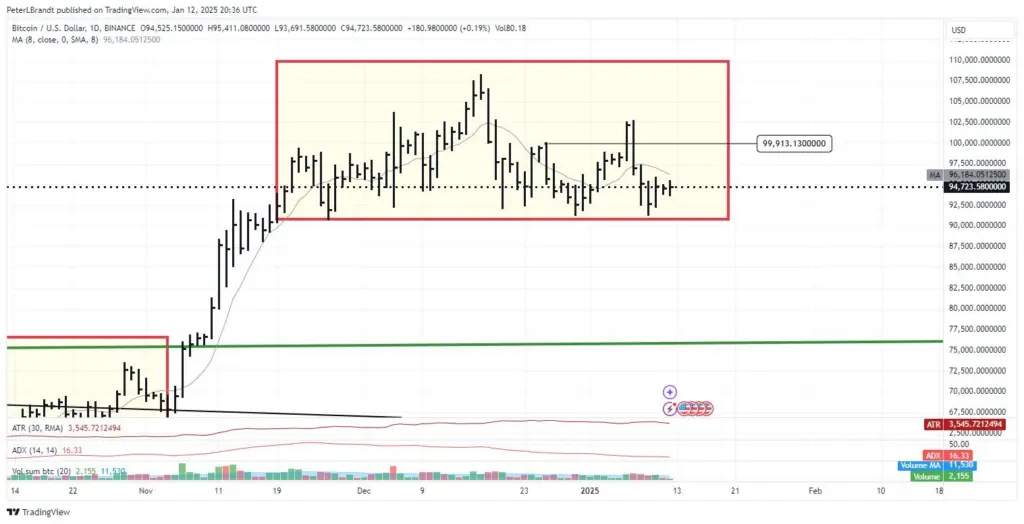
On the daily chart, BTC may have created a head-shoulders (H&S) pattern with three possible outcomes, according to a chart supplied by seasoned trader Peter Brandt.
Brandt contended that BTC might validate the pattern, finish the trend, and hit the H&S formation’s goal below $77,000 in the first scenario.
A bear trap or “morph into the larger pattern” results from the price finishing the pattern but falling short of the target in the other two scenarios.

A fellow analyst, Bitcoin Munger, also noticed large bids accumulating on Binance between $85,000 and $92,000. He questioned if the price of BTC would decrease to satisfy these bids or increase to satisfy the ask orders at $110,000.
“Be prepared for either scenario, as I believe $110k is coming either way.”


