Ether’s price has the potential to reach new all-time highs, provided it can maintain a weekly close above the $4,000 mark probably signaling a significant upward trend for the cryptocurrency
According to a significant technical chart formation, the price of Ether is poised to surge to all-time highs.
Can Ether convert the psychological threshold of $4,000 into support?
A pattern on the ETH price chart suggests a possible breach.
In the past week, the price of Ether increased by more than 27%, transforming significant areas of resistance into areas of support.
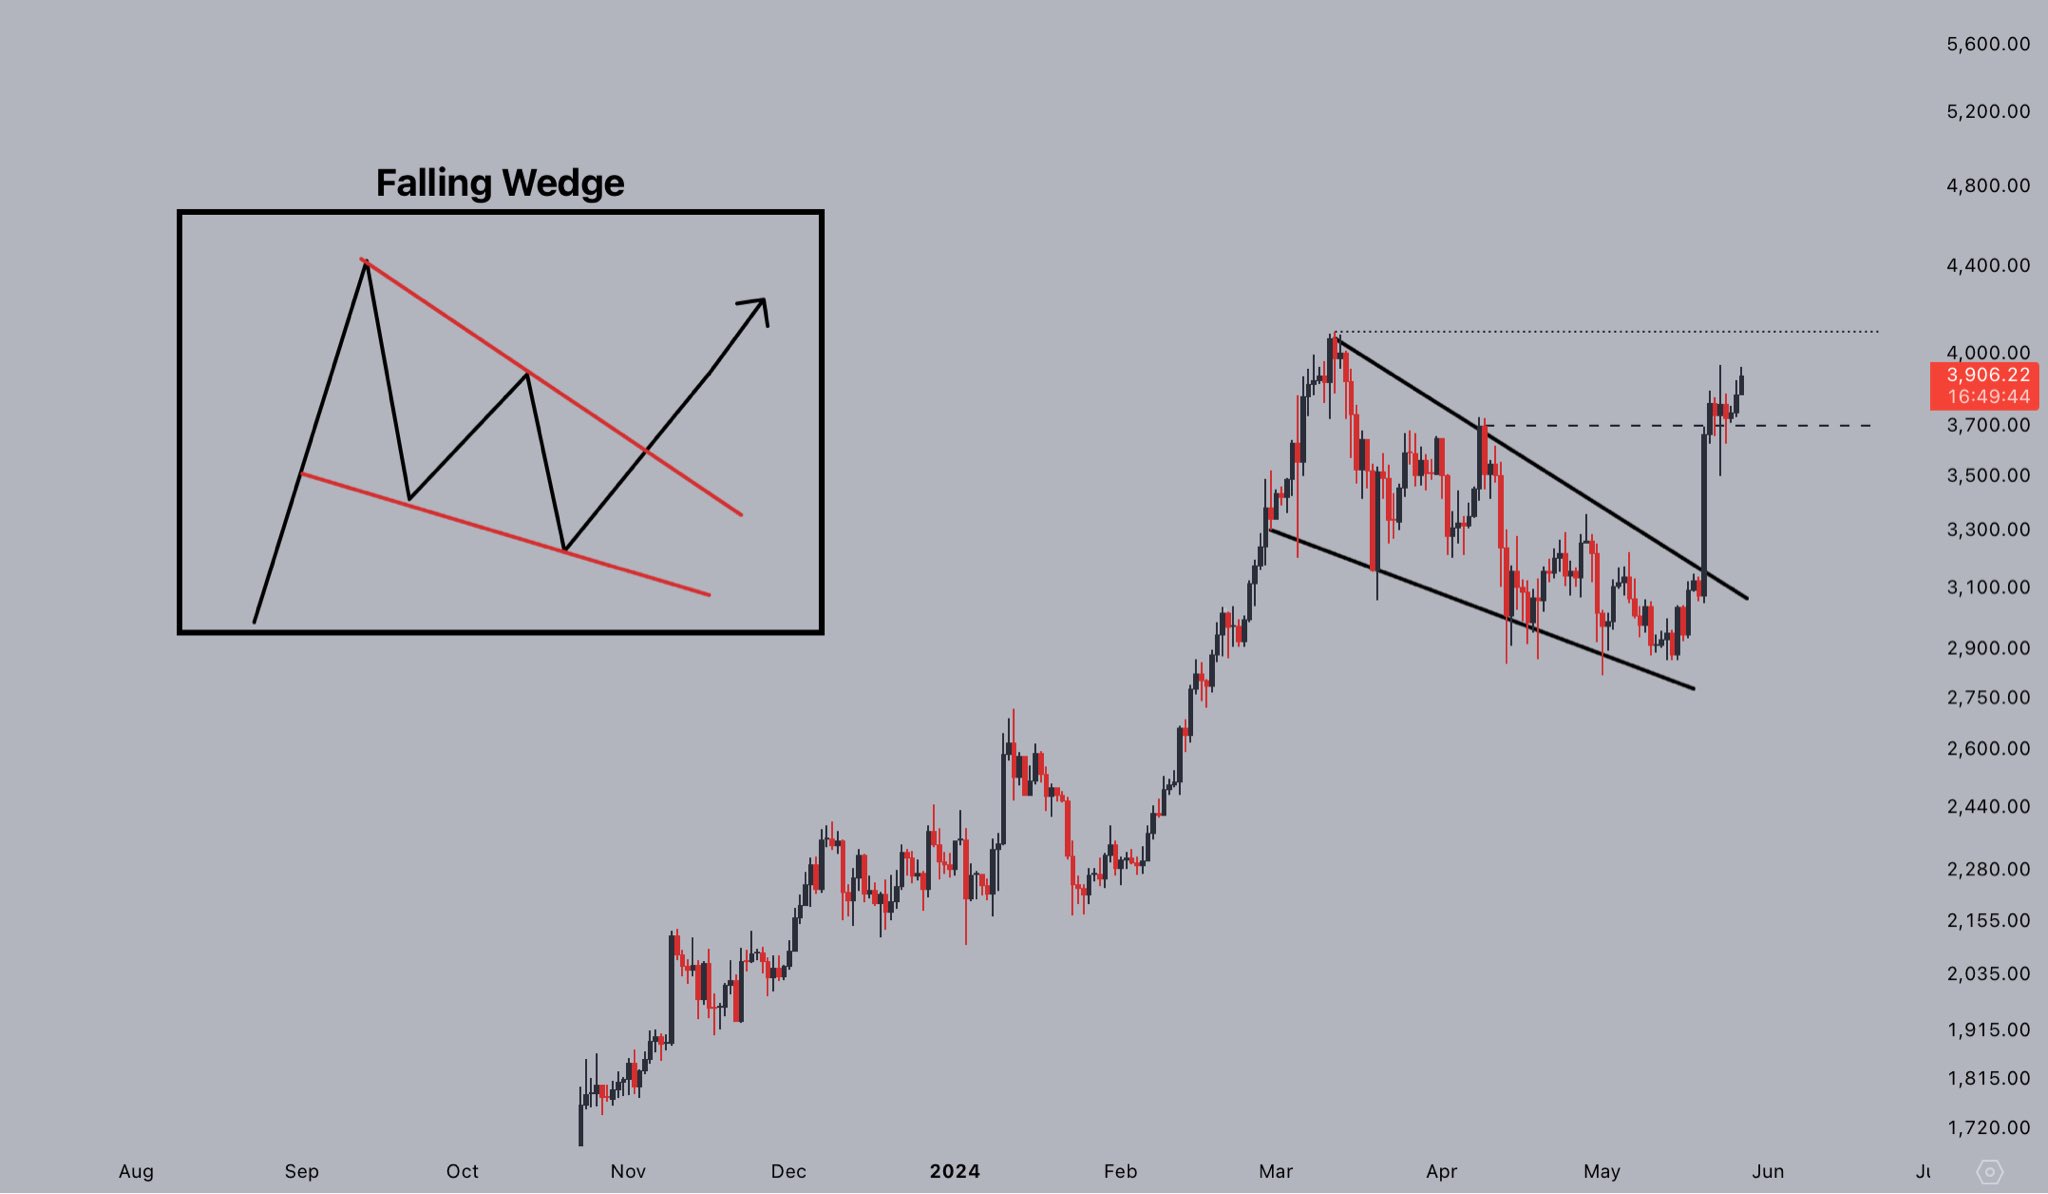
Ether has exited its falling wedge chart configuration, which signifies a possible reversal of the downward trend that followed its price surge.
The breakout could signal a rally to new all-time highs, according to a May 27 X post by the pseudonymous crypto trader Jelle to his 83,000 followers:
“$ETH broke out from the falling wedge, then flipped key areas into support & now pushes for $4,000. New highs and new all-time highs are next.”

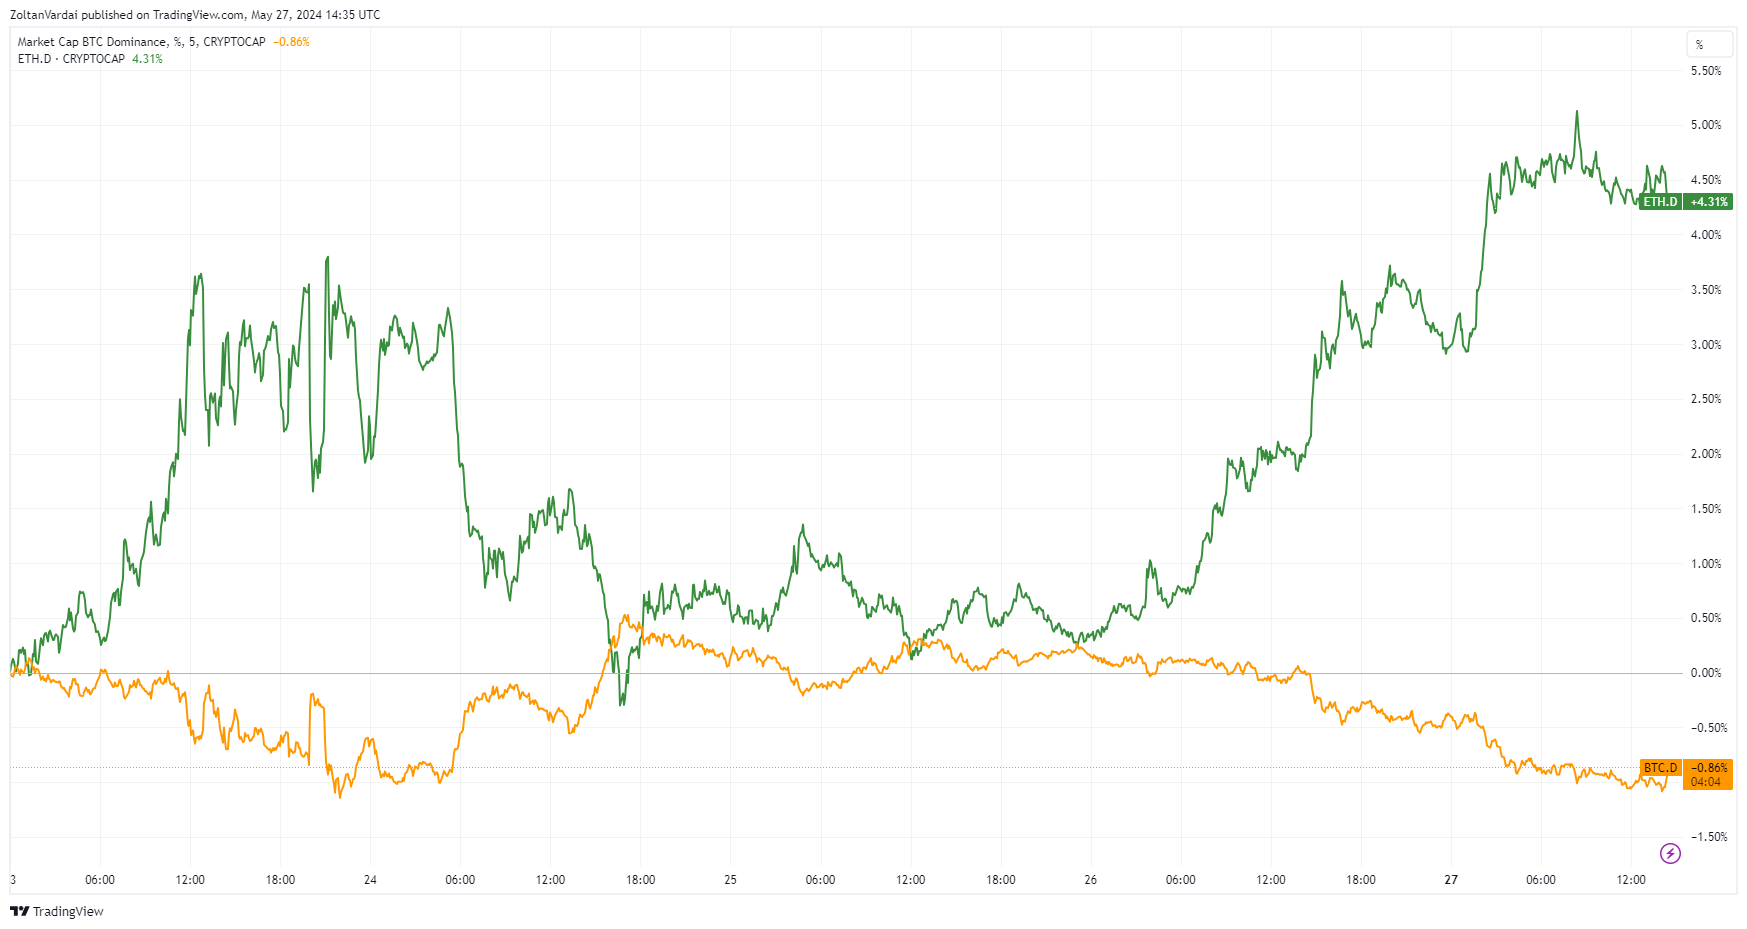
As evidenced by the recent rebound in the ETH/BTC pair, the declining dominance of Bitcoin also indicates that traders are shifting their focus to Ether.
In contrast, Ether’s dominance increased by 4.4% over the past five days, whereas Bitcoin’s declined by over 0.98%.
TradingView reports that Ether’s dominance increased by 1.45% in the previous twenty-four hours, whereas Bitcoin’s dominance declined by 0.57%.

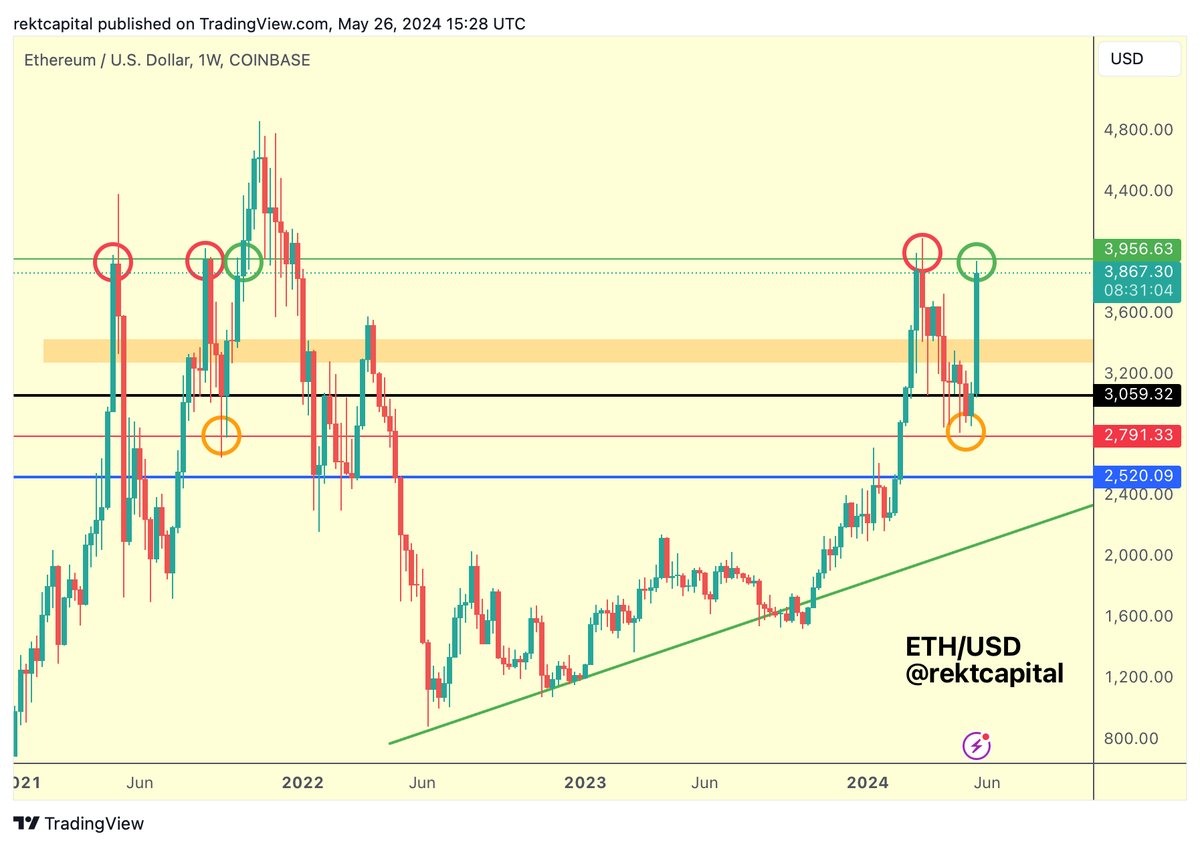
Analyst: The price of ETH must conclude the week above $3,956.
The primary catalyst for the present upward trend in Ether’s value is favorable developments concerning first-spot Ether exchange-traded funds (ETFs).
The price of Ether increased by approximately 20% in a single day on May 20, after reports that the United States SEC reversed its stance on spot Ether ETFs—possibly due to political pressure—and requested ETF exchanges to revise their 19b-4 filings.
Arthur Cheong, the founder and CEO of crypto-focused investment firm DeFiance Capital, predicts that the price of Ether could surge to $4,500 before the initial public offering of spot Ether ETFs, thereby elevating investor optimism.

Via his X post on May 26, Cheong communicated with his 167,000 followers as follows:
“4.5k before spot ETF goes live for trading [in my opinion].”
Nevertheless, Ether’s price encounters substantial resistance at the psychological $4,000 threshold. CoinGlass data indicates a potential rise above $4,000 would liquidate cumulative leveraged short positions worth over $433 million across all exchanges.

A weekly close above $3,956 is ultimately required to validate sustained bullish momentum for the ETH price, according to renowned crypto analyst Rekt Capital, who wrote in a May 26 X post:
“Ethereum just needs to Weekly Close above $3956 (green) to move into $4000+ territory. At the moment, #ETH is forming a Lower High.”


