Over the past few years, Ethereum’s gas consumption by NFTs has undergone substantial changes, primarily due to the rise and fall of various platforms
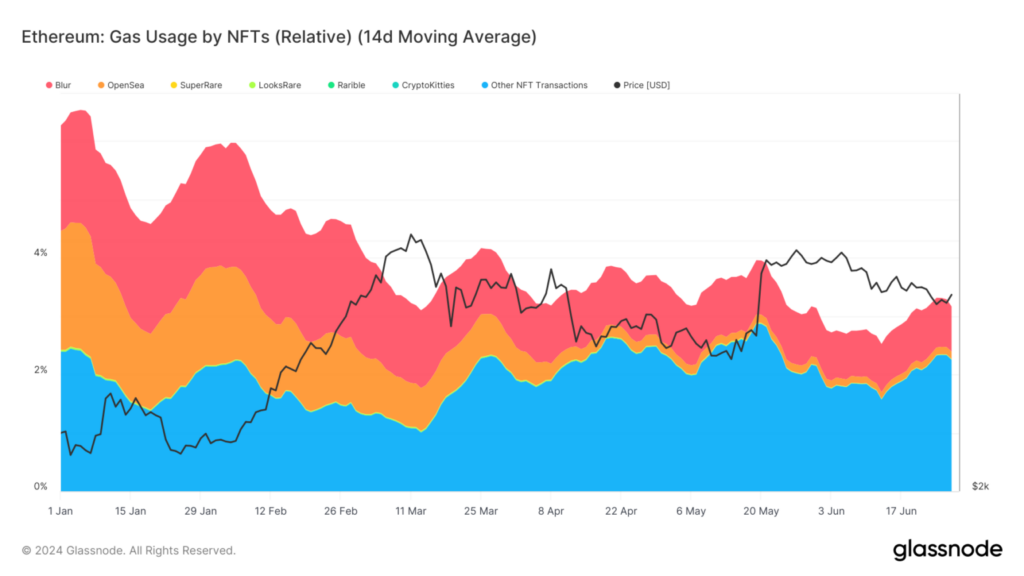
According to recent data, Blur and OpenSea have maintained their dominance in gas consumption since early 2024.
This indicates the escalating activity on these platforms, as traders and collectors persist in participating in the NFT market. In contrast, platforms such as Rarible and SuperRare exhibit relatively reduced gas usage, indicative of their smaller user bases or less frequent business transactions.

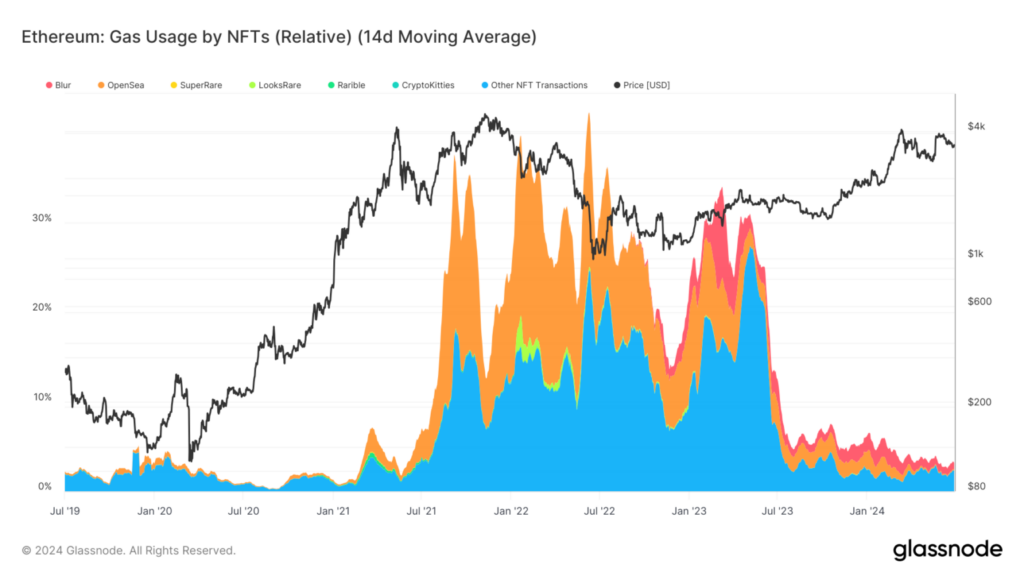
In the past, there has been a correlation between substantial increases in gas consumption by NFT transactions and broader trends in the price movements of Ethereum.
For example, the surge in early 2021 was concurrent with a significant bull run in the crypto market, resulting in increased gas fees and greater transactions. The interconnectedness of these metrics was illustrated by the normalization of NFT-related gas consumption as Ethereum’s price stabilized in mid-2023.
The current landscape indicates that, despite the emergence of new NFT marketplaces, established platforms such as Blur and OpenSea continue to maintain relative dominance, thereby influencing Ethereum’s overall gas consumption patterns. This dynamic is essential for comprehending the operational costs and transaction efficacy of the Ethereum network.

Although the relative utilization may be consistent with previous cycles, the overall NFT gas usage has decreased as a percentage of overall network activity since January 2023. At its highest point, gas consumption exceeded 40%, consistently exceeding 30%.
The current levels are below 4%, partially attributable to the growing prevalence of layer-2s, such as Base and side chains like Polygon, and an overall decline in the NFT market.


