A decline in institutional interest and concerns about a Bitcoin market dump are the leading causes of Ethereum’s slump.
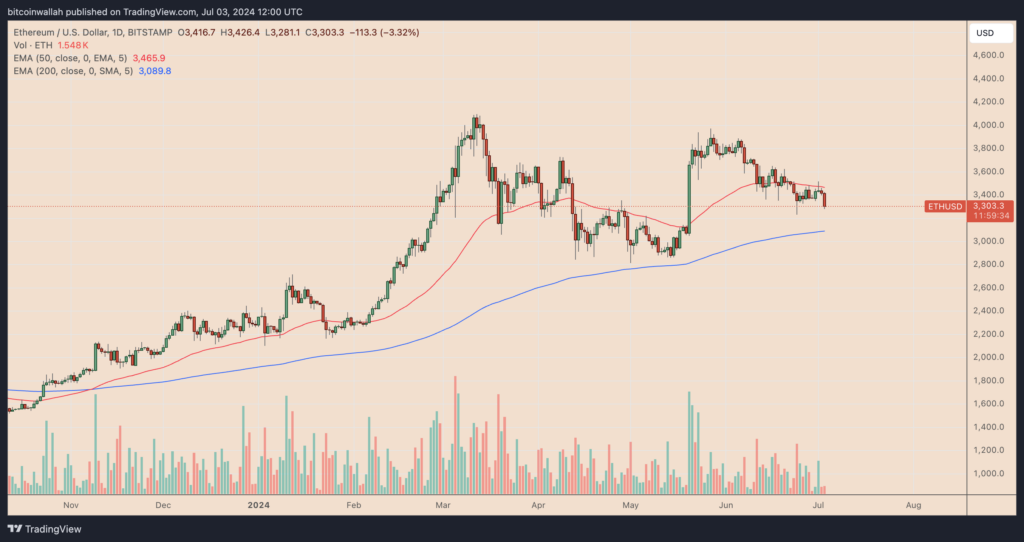
On July 3, Ethereum’s native token, Ether ETH$3,316, saw its worst daily performance in three weeks, falling 4.24% to roughly $3,280. In doing so, the cryptocurrency has dropped from its local high of about $39,750, set over a month ago, by almost 18%.

Fears of a prominent Bitcoin market dump, its impact on the broader crypto market, and evidence of diminishing institutional interest are the leading causes of Ether’s decline.
FUD about Bitcoin invades the cryptocurrency market
The losses seen by the Ether market today are part of a more significant downward trend in the cryptocurrency market, fueled by worries about a possible massive sell-off of Bitcoin.
Notably, the planned start of Mt. Gox creditor repayments, which is scheduled to commence in early July, is connected to the downturn in the cryptocurrency market. The most recent data indicates that the creditors have started to transfer the money owed.
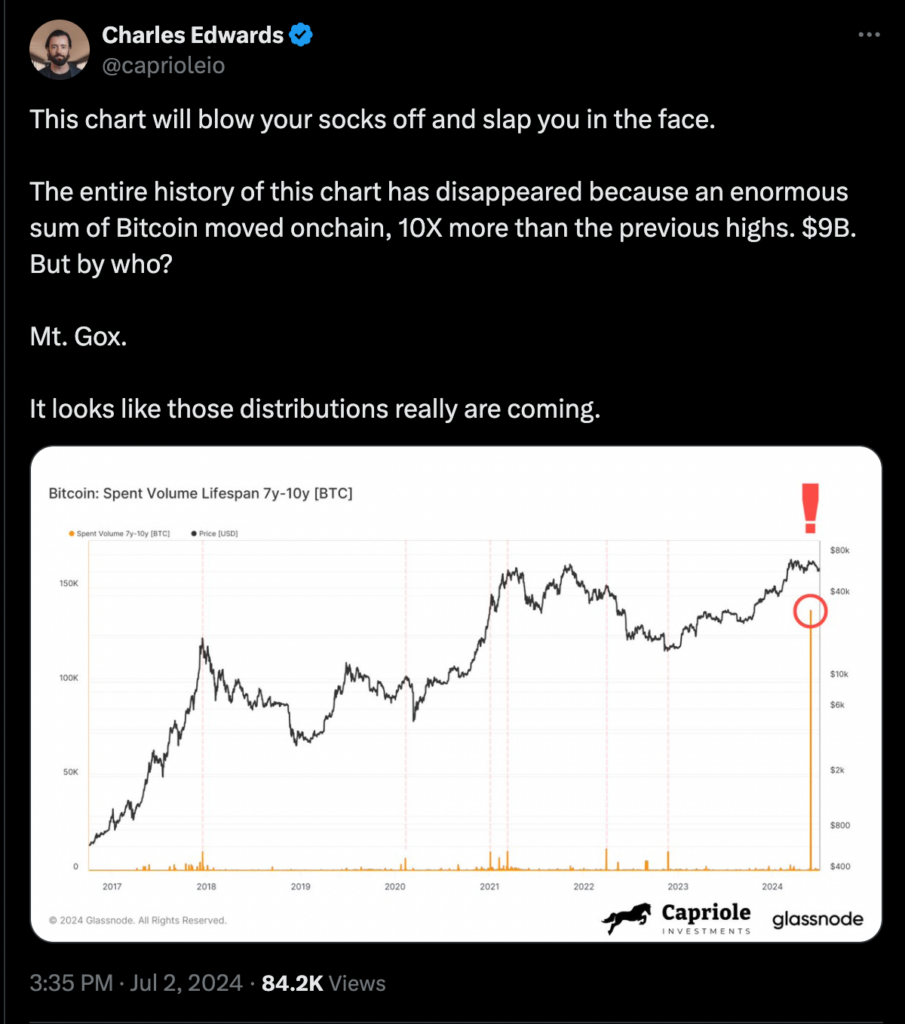
Charles Edwards, the founder of Capriole Investments, released a Bitcoin transfer volume chart showing that as of July 2, tokens that had last changed addresses seven or ten years ago were changing addresses again.

About 127,000 creditors of Mt. Gox are due more than $9.4 billion in Bitcoin, and they have been waiting more than ten years to get their money back. Many of these investors might decide to cash out when they receive their Bitcoin, which could affect the market.
As a result, on July 3, the price of Bitcoin fell 4.25% intraday to less than $60,000, with the price of ETH and the rest of the market following these losses.
Ethereum funds see the most significant withdrawals.
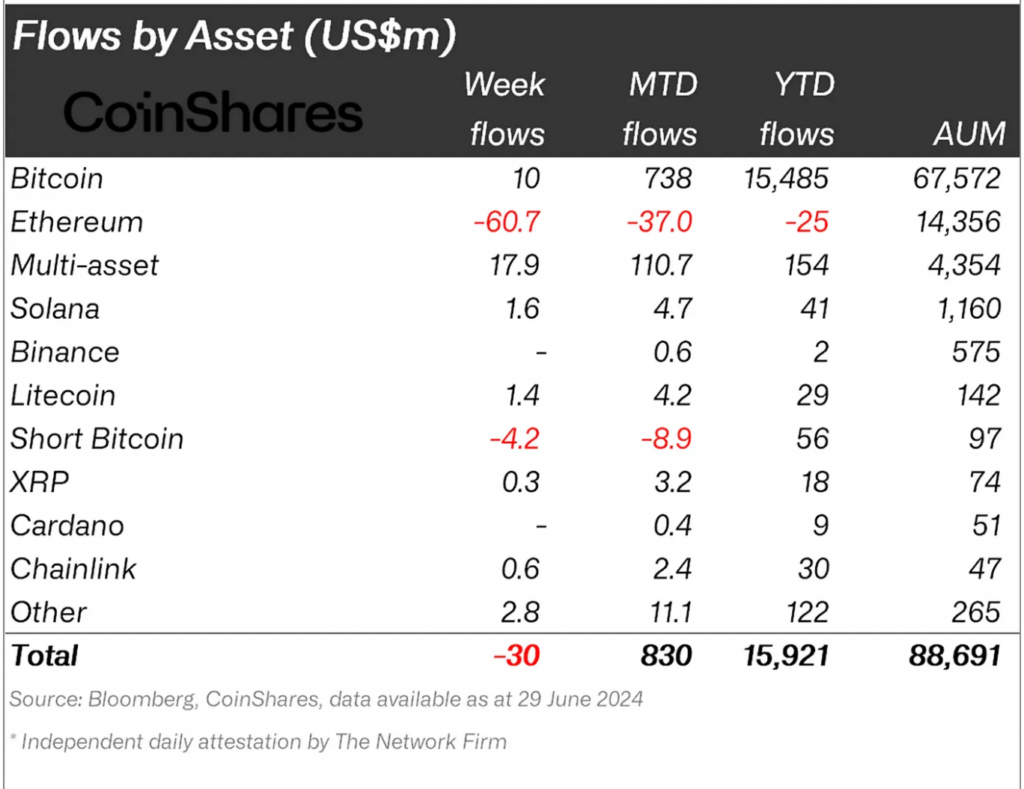
The losses in the ether market today come after a study by research firm CoinShares, which showed weekly withdrawals from Ethereum funds were at their highest point in over two years.
James Butterfill, a researcher at CoinShares, wrote:
“Ethereum saw the largest outflows since August 2022, totalling US$61 million, bringing the last two weeks of outflows to US$119 million, making it the worst performing asset year-to-date in terms of net flows.”

The withdrawals occurred during the week VanEck and 21Shares submitted their applications to the US Securities and Exchange Commission (SEC) to become exchange-traded funds for Spot Solana (SOL).
Over that time frame, $1.6 million in inflows into Solana-based investment funds suggested that interest in Ethereum’s top layer-1 blockchain rival had grown.
Technical decline in ETH prices
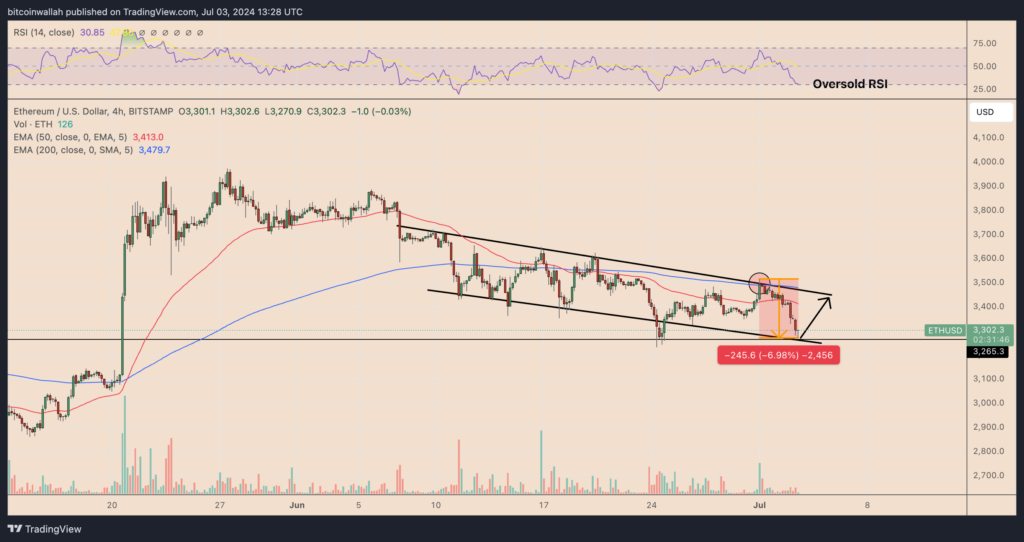
The price tested a resistance confluence comprised of its 200–4H exponential moving average (200–4H EMA; the blue wave) and the upper trendline of its prevailing descending channel pattern. This is when the price of Ether began to decline.

On July 3, the price of ETH attempted to test the channel’s lower trendline as support for a possible rebound move, which was encouraged by June’s resistance level at roughly $3,260.
The probability of the cryptocurrency reaching its 50-4H EMA (the red wave) at roughly $3,413 in July is considerable in the event of a strong rebound. The price may go toward the upper trendline, which is about $3,475 if the 50-4H EMA is decisively closed above.
