As long-term holders of Bitcoin keep piling up, a breakout from its symmetrical triangular pattern is about to occur.
Due to capital inflows into its recently launched exchange-traded funds (ETF) in the United States and expectations of Federal Reserve interest rate reductions, BTC$ 68,812 has increased by more than 60% yearly as of May 2024.
A combination of fundamental, technical, and on-chain indications suggests that the benchmark cryptocurrency could see more rises in June, with a peak of $75,000. Let’s go into more detail about these signs.
Bitcoin is near, symmetrical triangle breakout
Technically speaking, the reason behind Bitcoin’s potential to hit $75,000 is its current symmetrical triangle pattern, which is defined by the price settling between two convergent trendlines that link a string of consecutive peaks and troughs.
Creating a symmetrical triangle usually indicates a bullish continuation when an uptrend is in progress. The triangle resolves when the price breaks above the upper trendline and rises as much as the maximum distance between the upper and lower trendlines.
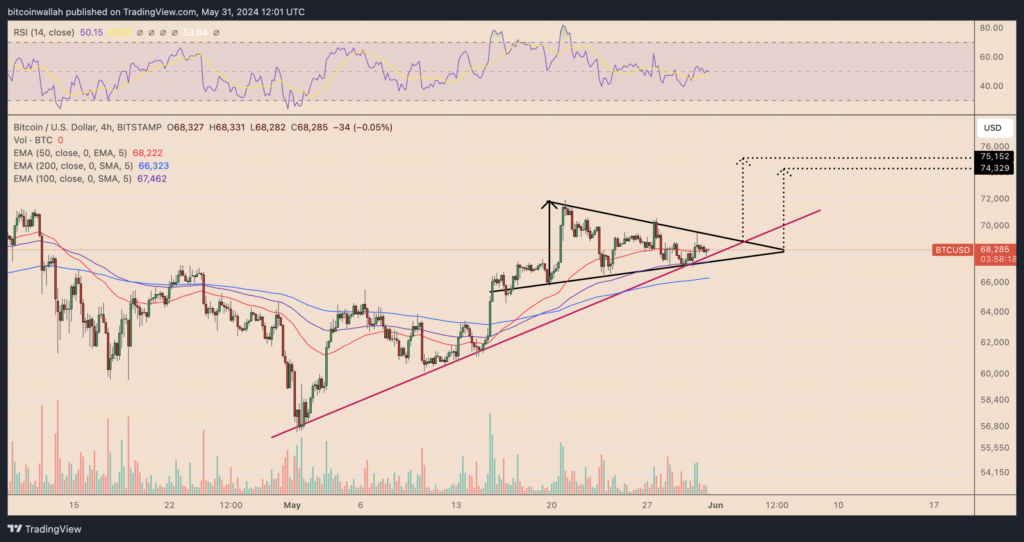
The triangle’s apex, where its two trendlines converge, is where the BTC price was approaching as of May 31. With a break above the upper trendline, the cryptocurrency might, according to the previously cited technical rule, push its price as high as $74,000–75,000 in June.
This breakout point may occur at $69,000, which corresponds with Bitcoin’s continuous climbing trendline support (the magenta line).
Buyers of Bitcoin ETFs return
Early in March, the price of Bitcoin hit a new all-time high of almost $73,000. Long-term investors sold off a sizable portion of their holdings simultaneously as this boom occurred, generating an oversupply that prompted a correction and consolidation phase.
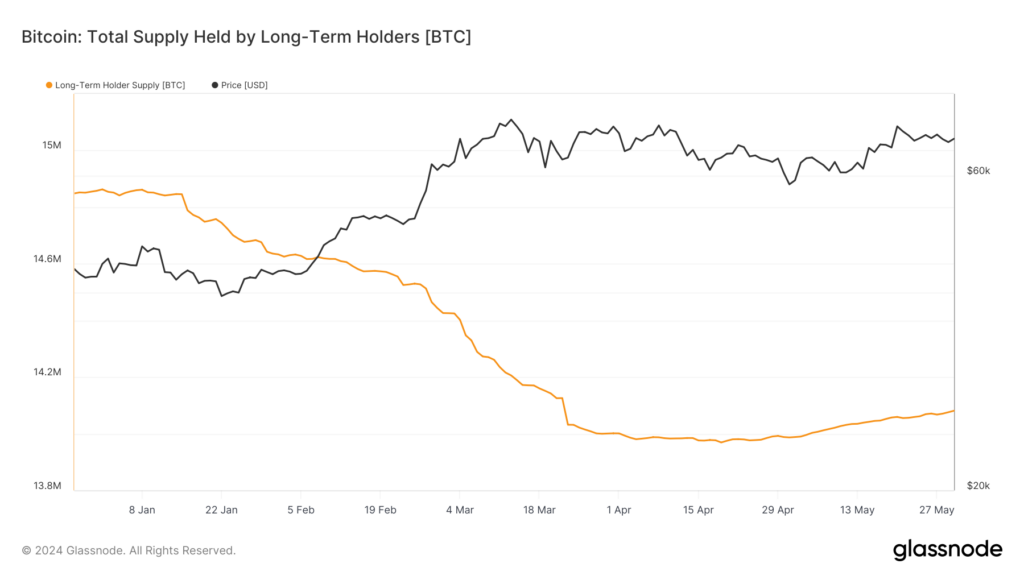
The market progressively entered a re-accumulation phase as prices fell and sellers ran out of inventory.
The Bitcoin ETF flows, which experienced a net outflow regime during April, clearly show this change. ETF net outflows were significant during the market sell-off to a local low of about $57,500, averaging -$148 million daily.
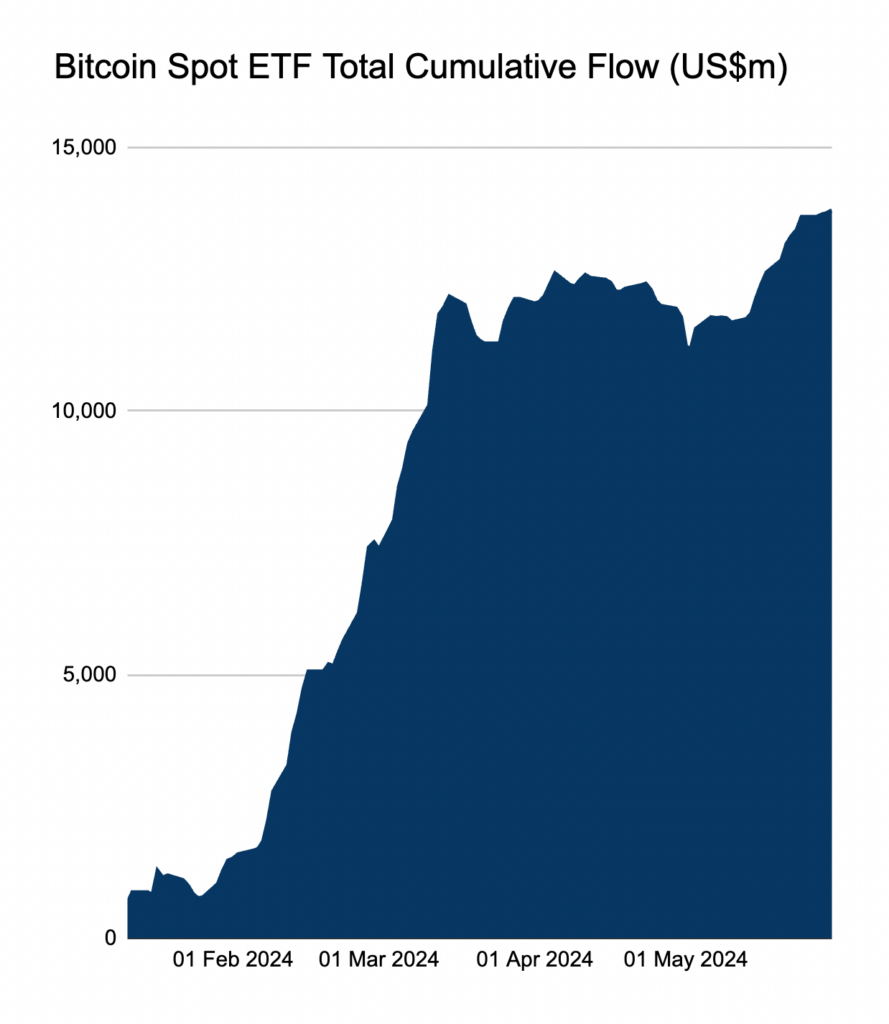
A type of micro-capitulation was evident during this outflow era, but the tendency has subsequently abruptly reversed.
The extraordinary net inflow of $242 million per day that Bitcoin ETFs reported last week suggests that buy-side demand is again rising. This ETF buy pressure is over eight times larger than the natural daily sell pressure from miners, which has been $32 million per day since the recent halving of Bitcoin.
This emphasizes the positive effect ETFs have on the market and how much less impact the halving will have going forward. Consequently, the price of Bitcoin is in an excellent position to keep rising until June.
June approval prospects for Ethereum ETFs
After a significant filing update by BlackRock, analysts believe that United States spot Ether (ETH) exchange-traded funds (ETFs) have a “legit possibility” of launching by late June.
BlackRock amended its Form S-1 with the Securities and Exchange Commission on May 29, almost one week after the agency accepted its 19b-4 filing for the iShares Ethereum Trust (ETHA). Both approvals are needed for the ETF to start trading.
“This is encouraging. In a post on X on May 29, Bloomberg ETF analyst Eric Balchunas stated, “We’ll probably see the rest roll in soon.”

The successful introduction of Ethereum exchange-traded funds (ETFs) may establish a favorable precedent for Bitcoin ETFs, enhancing investor assurance and augmenting demand within the cryptocurrency domain. This allows Bitcoin to surpass its June $75,000 symmetrical triangle breakout target.
