Positive macroeconomic factors are balancing Mt. Gox concerns with Bitcoin’s price, though some analysts foresee a potential dip below $50,000 soon.
A series of negative occurrences, including Mt. Gox’s continuous 140,000 BTC repayment to its creditors and the German government’s unrelenting BTC liquidations, have shaken Bitcoin BTC$56,964. Following the 15% decline in the price of Bitcoin during the first week of July, traders are now wondering if there are still drawbacks to the market, given that these variables increase the likelihood of BTC sales worth billions of dollars.
Analyst: Bitcoin will go below $38,000.
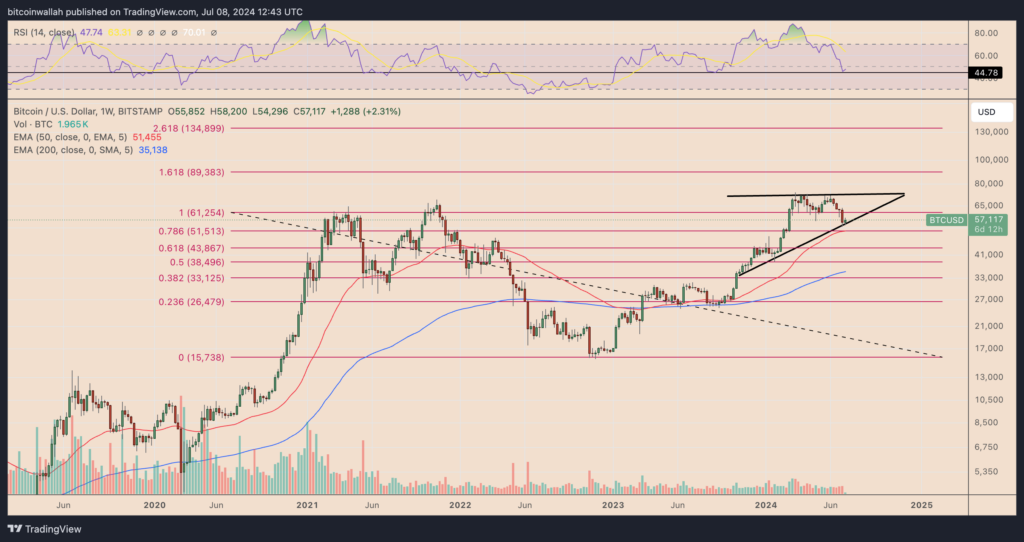
Independent market expert Matthew Hyland has stated that he believes Bitcoin will trade for less than $38,000.In his X post on July 8, Hyland supported his negative view by pointing to Bitcoin’s breakdown from a multi-month consolidation range on the weekly chart and pointing out how unlikely it is for the cryptocurrency to rebound inside the same range.

Bitcoin’s weekly relative strength index (RSI) rating of about 45 supported the pessimistic perspective.
Neither buyers nor sellers are in control at this RSI level. The current market slump suggests that the RSI still has more room to drop until it crosses the 30-point oversold threshold, which usually signals the start of a price recovery.
Similarly, Bitcoin may keep falling until the RSI hits the oversold reading 30, coinciding with Hyland’s goal price of less than $38,000.
“The weekly RSI has nearly pulled back to the August/September lows of last year when BTC was trading at 25k,” Hyland stated.
“Another red weekly candle would likely push the RSI lower which would then give opportunity for Bullish Divergence”
Is the next low point for Bitcoin $50K?
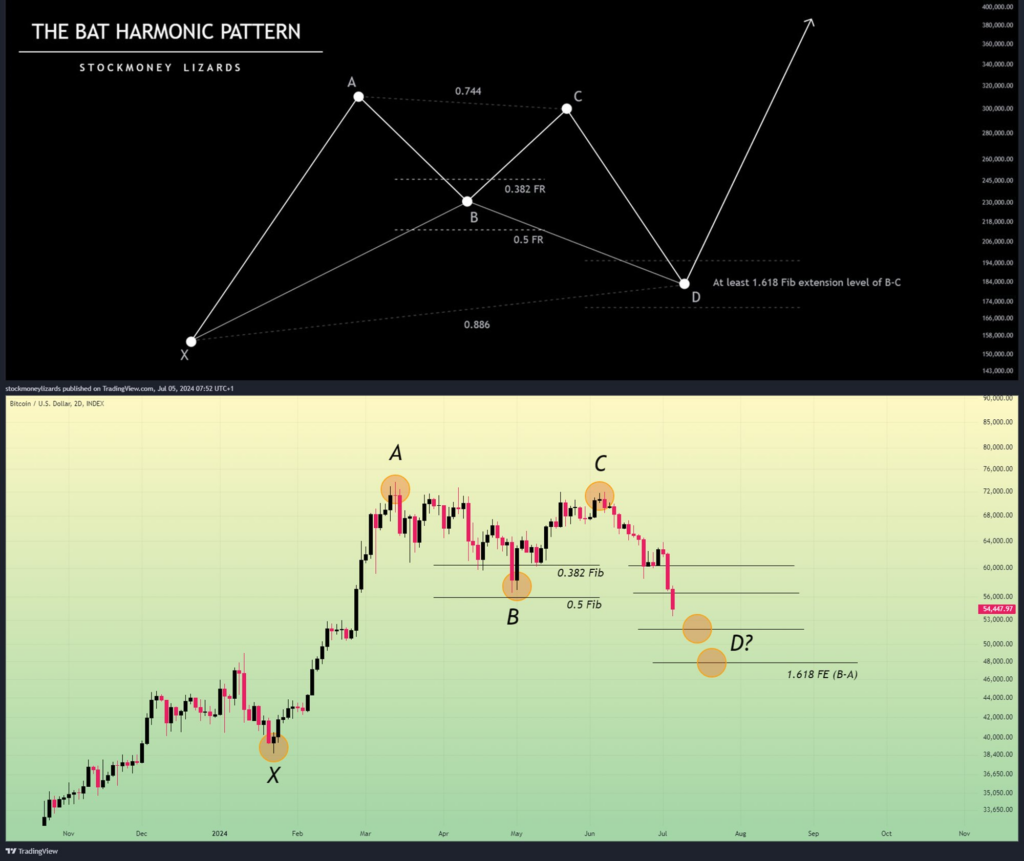
Another market expert who goes by the pseudonym Stockmoney Lizards predicts another Bitcoin price collapse. His downside objective is roughly $50,000, though.
The chartist bases his limited negative inclination on a so-called “Bat Harmonic” pattern. The pattern begins with a price move (X.A.), then moves in four different directions: backward (A.B.), forwards (BC), and finally, a final leg (CD) that covers 88.6% of the X.A. leg.

Point D is the crucial region where traders look for a reversal, frequently supported by other indicators like volume or candlestick patterns. Regarding Bitcoin, point D is in line with the $50,000 mark, after which a significant price increase might occur.
Stock money Lizards says, “We are waiting for another liquidity flush, possibly with a long wick below 50k to establish 52k support.”
“Daily RSI etc are already oversold, however, we believe there is still some more downside. Ideally we consolidate at 52k, forming a bullish divergence with high volume which would be the reversal signal for us.”
Macroeconomic Outlook for the Price of Bitcoin
The U.S. economy’s encouraging economic statistics, especially the rise in Wall Street betting on an interest rate cut in September, helped temper the pessimistic prognosis for Bitcoin during its current corrective cycle.
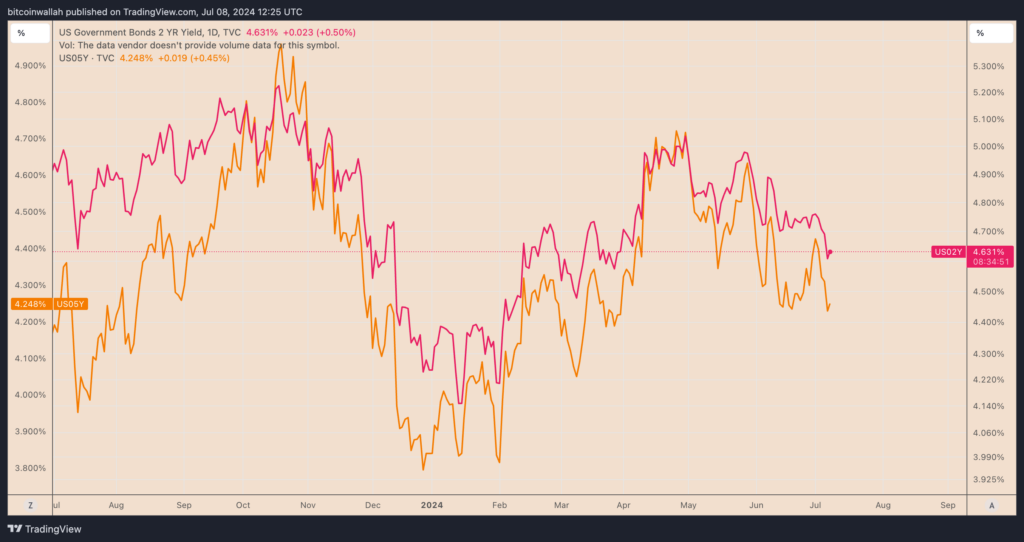
According to CME, as of July 8, futures rate traders raised their estimates for a 25 basis point rate decrease in September to roughly 67.3%, up from 46.6% one month earlier. Following the poor U.S. jobs data announced on June 5, precipitating a steep decrease in short-term rates, this shift toward a more dovish outlook has gathered momentum.

The opportunity cost of owning safer financial assets, such as U.S. bonds, is decreased by lower yields. Instead, they increase the demand for more volatile assets such as stocks and cryptocurrencies. The S&P 500 and Nasdaq indexes ended at all-time highs on June 5 last week.
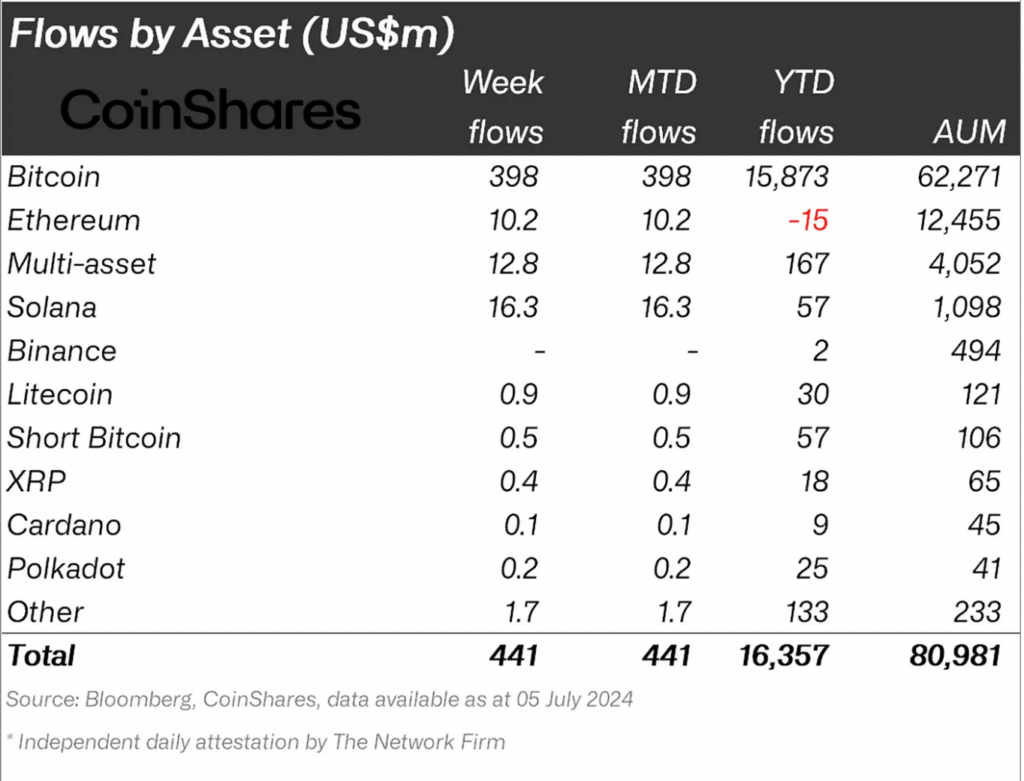
Bitcoin also joined the upswing and reversed the losses caused by the German government and Mt. Gox. Since June 5, when it reached its local low of $53,550, it has increased by 7%. These gains align with weekly inflows of $398 million into exchange-traded funds (ETFs) and other Bitcoin-based investment products.

According to James Butterfill, a researcher at CoinShares, “Digital asset investment products saw inflows totaling US$441 million, with recent price weakness prompted by Mt Gox and the German Government selling pressure likely being seen as a buying opportunity.”
The encouraging macroeconomic factors, along with the inflows into funds based on Bitcoin, are creating a favorable technical environment. Notably, BTC is presently testing the support of its multi-month ascending trendline, with an eye on a solid comeback toward the resistance of its multi-month horizontal trendline, which is located around $71,500, in Q3 2024.

On the other hand, a decline below the rising trendline support might cause the price to tumble down to its Fibonacci retracement level of 0.786, located at about $51,500. This level is closer to the analysis provided by Stockmoney Lizards above.

